Posted inIELTS Writing Test
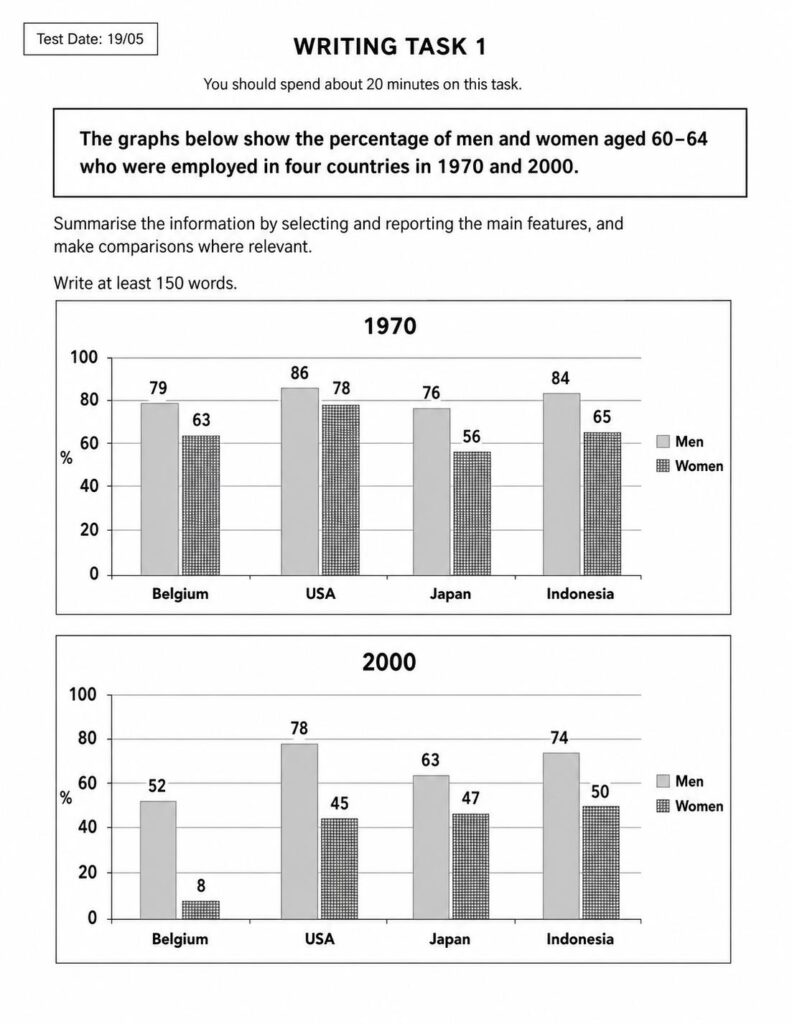
IELTS Writing Task 1: The graphs below show the percentage of men and women aged 60-64 who were employed in four countries in 1970 and 2000.
Lượt làm bài: 146
The graphs below show the percentage of men and women aged 60-64 who were employed in four countries in 1970 and 2000.