Posted inIELTS Writing Test
IELTS Writing Test 21 July 2026: Table – Health spending in five countries | Agree or disagree – Celebrity privacy and media attention
Lượt làm bài: 134
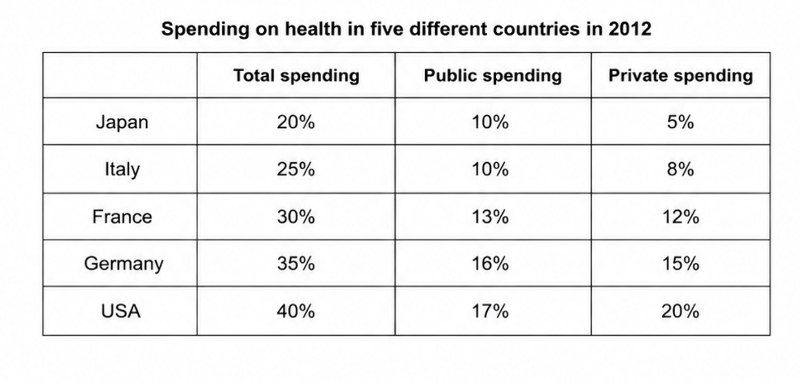
Task 1: The table below shows information about spending on health in five different countries in 2012. Summarise the information by selecting and reporting the main features, and make comparisons where relevant.
Task 2: In some countries, celebrities complain about the way the media publicize their private lives. Some people say that they should accept it as part of their fame. To what extent do you agree or disagree?