Posted inIELTS Writing Test
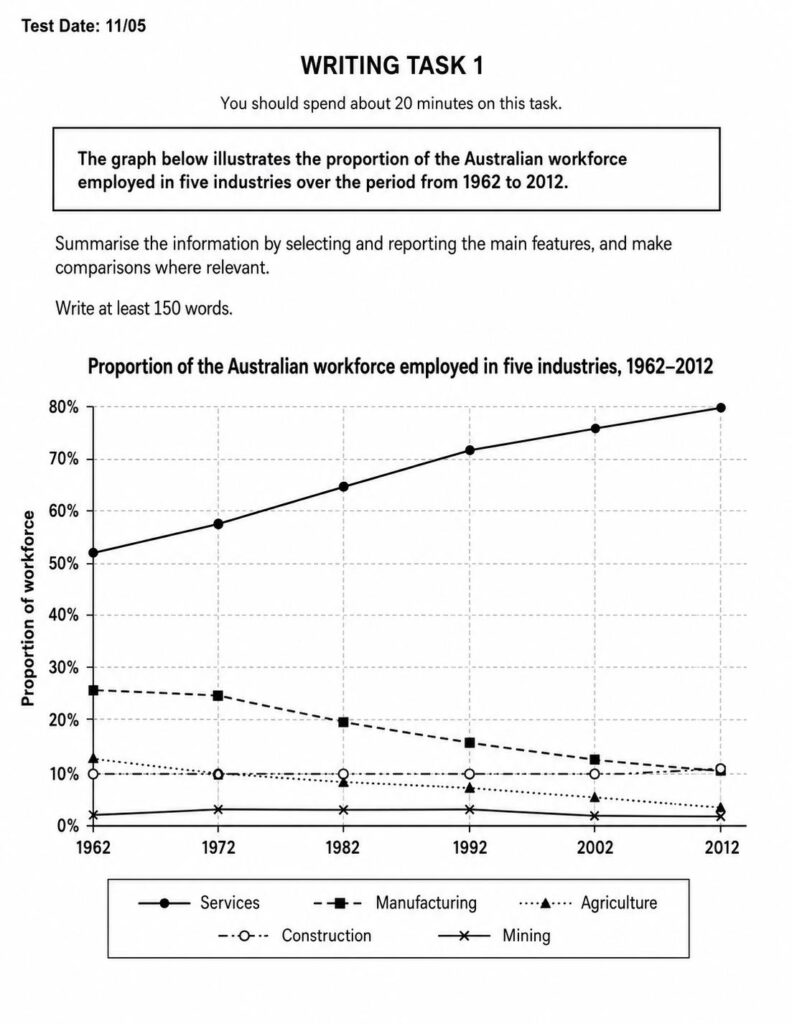
IELTS Writing Task 1: The graph below illustrates the proportion of the Australian workforce employed in five industries over the period from 1962 to 2012.
Lượt làm bài: 65
The graph below shows the three different kinds of emission sources (oil / coal / gas) of greenhouse gas in the UK.